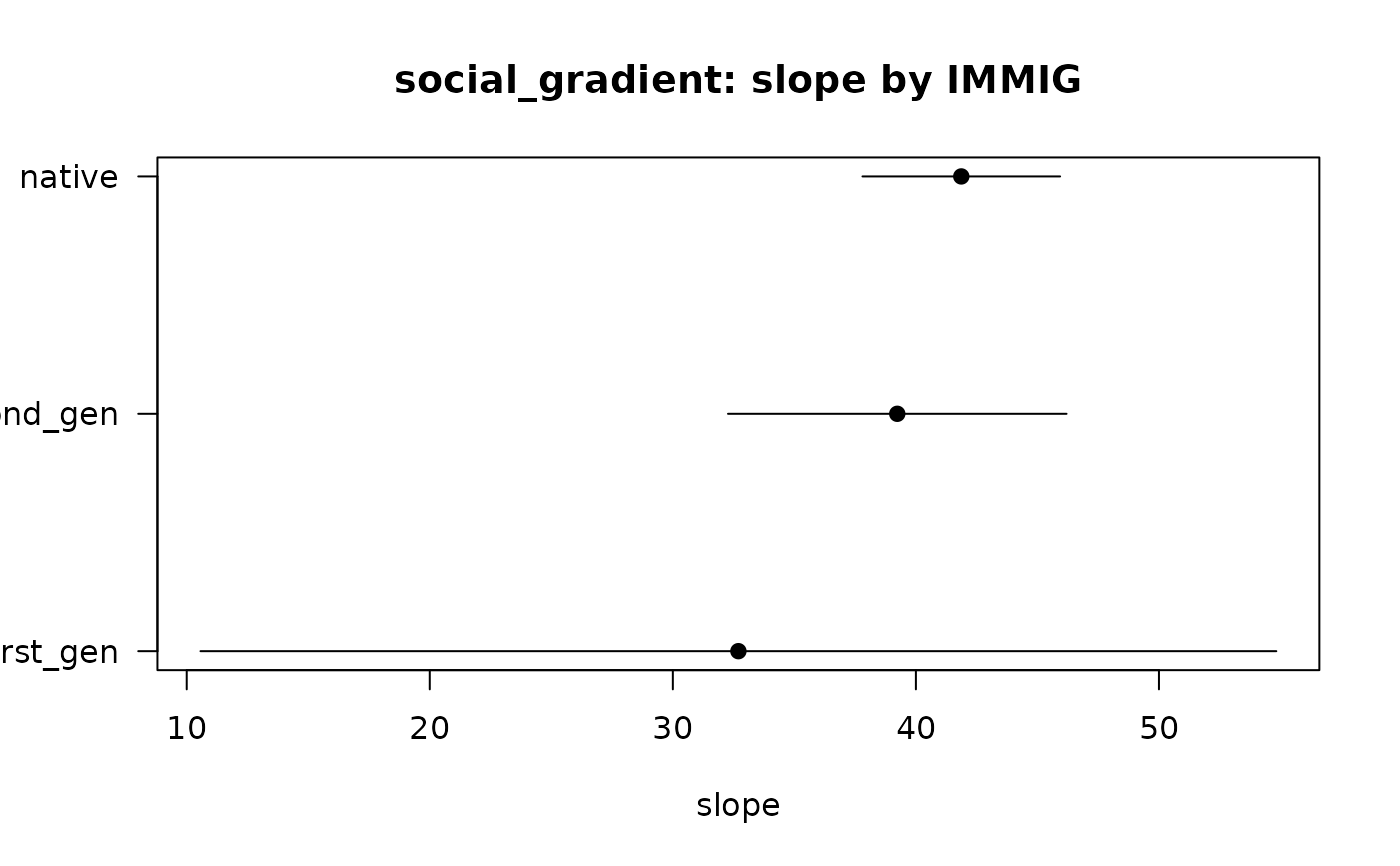
Plots the point estimate and confidence interval of one term across the
groups produced by lsa_by(), sorted by estimate. A horizontal axis shows
the quantity; each row is a group.
Usage
# S3 method for class 'lsastrat_by'
plot(x, term = NULL, sort = TRUE, ...)
Arguments
- x
An
"lsastrat_by"object.- term
Which term (row name) to plot; defaults to the first term.
- sort
Logical; order groups by estimate (default
TRUE).- ...
Passed to
graphics::plot().